
Goods-to-Person Picking: How Many Workstations Do You Need?
The number of goods-to-person picking workstations depends on the work required to complete the peak order mix: identifying products, moving units, confirming quantities, changing order containers and handling exceptions. Calculate that workload first, then check whether inventory delivery, replenishment and packing can support it. A robot count or a maximum bin-presentation rate cannot supply the answer on its own.
For a buyer, the useful deliverable is a staffing and operating plan for each peak window. It should explain how many stations are installed, how many are staffed for picking, which serve replenishment, and what happens when several orders wait for their final item. Those counts can differ within the same hour.
What the New Texas Facility Actually Demonstrates
In its October 26, 2026 announcement about Cutter & Buck, Kardex described a new Grand Prairie distribution center with 50,502 storage bins, 32 AutoStore R5 Pro robots and 13 ports supporting inbound and outbound operations. It reported a target of 1,256 bin presentations per hour and a simulation average of 1,284. These are different evidence categories; the announcement does not present either figure as measured orders shipped per hour.
The project connects automated picking with downstream activities including embroidery, order routing and shipping. It illustrates why the buying question extends beyond robot movement. Its 13 ports are not described as 13 simultaneously staffed picking stations, and dividing its throughput target by that count would not establish an operator productivity standard.
AutoStore is a grid-based automated storage and retrieval system: robots travel above stacked inventory bins. Floor-running AMRs that carry racks or containers to people represent another goods-to-person architecture. Both require workable human stations, but their delivery mechanisms, buffers and expansion constraints differ. The following method addresses station work without treating these technologies as interchangeable.
Define the Work a Station Must Complete
Goods to person describes how inventory reaches the picker. It does not necessarily mean that a robot grasps individual products. In many automated picking systems, retrieval and transport are automated while a person selects items and places them into order containers. FORTNA's technical discussion separates storage, workstation activity and the connecting transport system; it also distinguishes operator picking from a robotic picking arm.
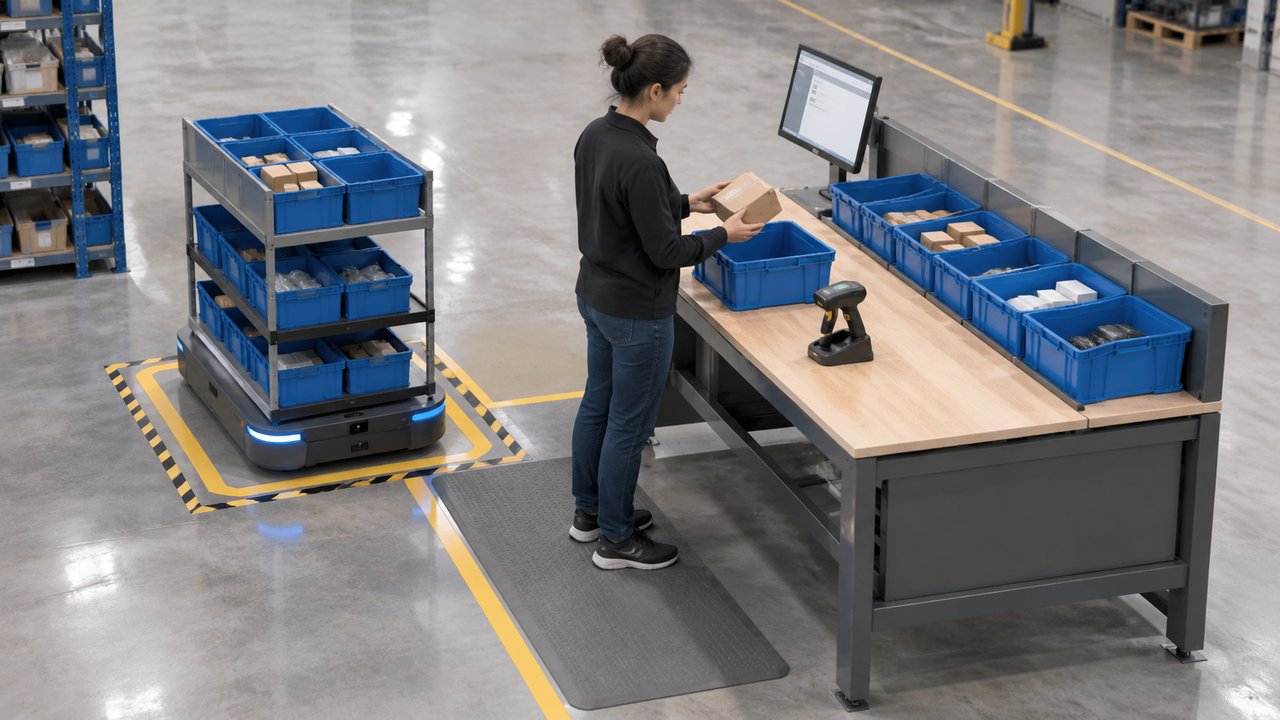
Define the counting rules before comparing order picking systems. A line usually represents a SKU requirement within an order, but lot, serial-number or allocation rules can create additional transactions. A five-unit line is not five order lines, and completing one line does not necessarily finish its order.
| Measure | What it counts | Check before using it for capacity |
|---|---|---|
| Units picked | Individual pieces transferred | Quantity per line, item handling difficulty and extra identification steps |
| Completed order lines | Demand lines fulfilled to the required quantity | Whether shortages, retries and cancellations are excluded from successful output |
| Donor presentations | Inventory containers or carrier positions made available for picking | Useful lines completed per presentation; distinguish donor inventory from order containers |
| Completed orders | Orders with all required lines reconciled | Split zones, partial containers and remaining checks before release |
| Shipped packages | Packages released through the shipping process | Packages per order, packing time, labeling and departure deadlines |
Use time-stamped demand from the relevant peak window. Preserve order identities, line quantities, release times and deadlines. A daily total spread evenly over eight hours hides a late carrier cutoff or a promotion concentrated into ninety minutes. Include representative workers and the actual product mix when measuring warehouse picking efficiency; a short trial with easy items cannot establish a full-shift rate.
Convert Bin Presentations Into Useful Order Lines
A donor bin containing one popular SKU may satisfy several open orders before it leaves the station. Conversely, a presentation can produce no completed line when stock is missing or identification fails. Calculate useful completed lines per donor presentation from the proposed order-release and batching rules, including unproductive visits in the denominator.
For an original hypothetical example, a peak hour requires 1,500 completed lines. If each donor presentation supports an average of 1.5 completed lines, the station group needs 1,000 presentations. If the average falls to 1.2, it needs 1,250. The same outbound demand now requires 25% more donor visits, before considering replenishment movements.
These ratios use all donor visits, including repeat and unsuccessful visits. The later exception allowance adds investigation work, not another hidden set of presentations. If a supplier instead calculates its ratio from successful visits only, add failed visits and recovery presentations separately before sizing delivery capacity.
The higher ratio is not available simply because popular products exist somewhere in the order book. Compatible orders must be released, their target containers must be accessible, sufficient stock must be available, and the software must group the work before the donor leaves. An urgent order arriving after a batch closes may require another visit.
A larger batch also needs somewhere to put its orders. In a February 2023 project announcement for Kuehne+Nagel, Klinkhammer described stations accepting up to four order bins and a separate consolidation buffer. That is a specific planned configuration, not a universal limit or a current throughput result.
For your design, identify physical order positions, permitted partitions and usable container sizes. Four positions cannot simultaneously host eight separate full-size order totes without an additional exchange or buffering process. Larger orders may consume several containers. More positions can increase walking or reaching within the station, so batching benefits and handling time must be tested together.
Build the Cycle Time From the Work People Do
Continue the hypothetical peak hour with 1,500 completed lines, two units per line and three lines per order. Assume each order fits one container: this creates 3,000 unit transfers and 500 order-container releases and replacements. These are planning assumptions, not results from Cutter & Buck or specifications for any supplier.
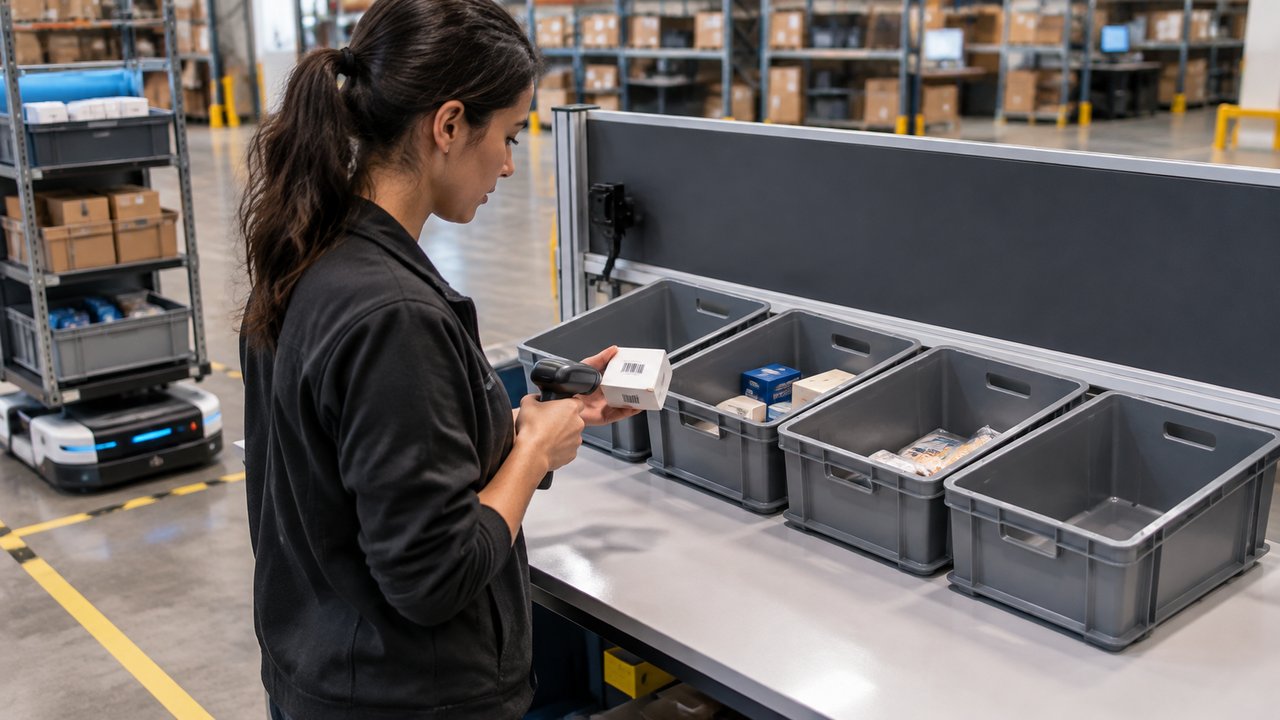
Use distinct event times rather than one unexplained picks-per-hour figure. In this example, source-container readiness takes six seconds per donor presentation; it excludes per-line identification. Each line requires three seconds for identification or scanning, two unit transfers at 3.5 seconds each, and two seconds for confirmation. One complete order-container release and replacement takes twelve seconds.
| Work in the hypothetical peak hour | Calculation | Station work required |
|---|---|---|
| Identify, transfer two units and confirm each completed line | 1,500 × (3 + 7 + 2 seconds) | 18,000 seconds |
| Handle donor readiness at 1.5 completed lines per presentation | 1,000 presentations × 6 seconds | 6,000 seconds |
| Release completed order containers and install replacements | 500 exchanges × 12 seconds | 6,000 seconds |
| Investigate and hand off additional shortage exceptions | 30 events × 30 seconds | 900 seconds |
| Total station workload | Sum of the four distinct activities | 30,900 seconds |
The exception allowance covers additional checks, handoffs and failed-attempt handling not counted elsewhere, not thirty successfully picked lines. It does not include all downstream resolution work. Achieving the completed-line target still requires stock or an approved resolution that genuinely fulfills the demand; recording a shortage is not completion.
Assume a staffed station has 54 usable minutes, or 3,240 seconds, in the hour after separately defined personal and planned downtime allowances. Dividing 30,900 by 3,240 gives 9.54, so ten simultaneously staffed picking stations are the arithmetic minimum. Their combined allowance leaves only 1,500 seconds of unused work capacity across the whole group.
Now change only the batching outcome to 1.2 lines per presentation. Donor work rises to 7,500 seconds and total work reaches 32,400 seconds, exactly the allowance of ten stations. There is no remaining margin for unmodeled variation. An eleventh staffed station, a better batching rule or reduced handling work are options to test; buying more warehouse picking robots does not directly remove these operator tasks.
This additive model assumes the listed activities occupy the operator sequentially. If verified equipment motion overlaps manual work, count only the portion that blocks progress. Do not charge the same scan to both donor readiness and line identification. Likewise, the 54-minute allowance must exclude losses already timed in the table. Every deducted minute needs one clear home.
Measure the process the business actually requires. A serial-number capture on every unit changes the per-unit component; a lot check once per source changes a different component. Repacking a fragile item may belong at picking or at packing, depending on the approved workflow. Record that location before comparing supplier demonstrations. Removing a required check to achieve the demonstration rate would change the service being purchased.
Check the Delivery Pattern, Not Just the Average Rate
Goods to person robots must deliver usable inventory to the stations that need it. An adequate system-wide presentation rate can coexist with one starved station and another surrounded by bins. Check supply by station, by short time interval and by order priority, including the longest meaningful gaps between ready donors.
For storage-layout constraints, see our guide to reusing warehouse racking with rack-climbing robots. Workstation capacity remains a separate design decision.
Ask suppliers to replay the same order set with the actual number of order positions. Preserve the arrival pattern, shortages and replenishment demand. Report ready-donor waiting time separately from worker absence, picking activity and blocked outbound containers. An average waiting percentage alone will conceal whether losses occur during slack periods or immediately before dispatch.
Inventory travel can overlap picking when the architecture provides suitable queues or independently accessible donor positions. That overlap has limits: a queue holding the wrong SKUs does not feed the current orders, and an additional donor opening is not another staffed workstation. Verify access, sequencing and the response when a priority change invalidates the next planned presentation.
For rack-carrying floor AMRs, specify what a presentation means: one rack arrival may expose several inventory locations, each requiring different operator movement. Do not apply a bin-based conversion factor unchanged. The comparison should still end in completed lines and orders, using the work and delivery pattern of the offered architecture.
Keep Replenishment From Consuming the Picking Window
Warehouse replenishment consumes both material-delivery resources and human station time. AutoStore's ConveyorPort documentation confirms that a port can switch between picking and replenishment. This supports operational flexibility; it does not make the two activities simultaneous or prove that every proposed station has the same handling capabilities.
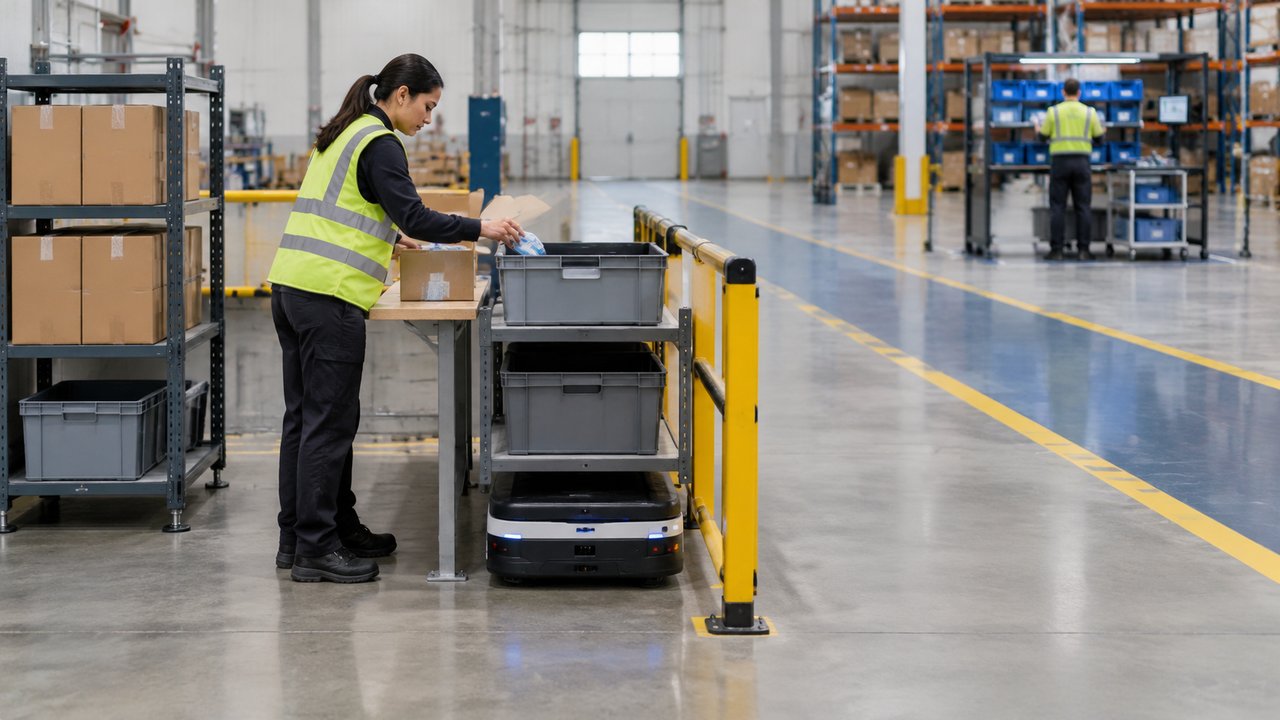
In the same hypothetical hour, suppose inbound work requires 180 replenishment transactions at 24 seconds of station occupation each. That is 4,320 seconds, or 72 station-minutes. If borrowed from the ten picking stations, it reduces their usable picking allowance from 32,400 to 28,080 seconds, below the original 30,900-second requirement. The time cannot appear in both budgets.
A separate replenishment plan could use dedicated capacity, a different shift or a controlled window before the outbound peak. Moving the work earlier is valid only if receipts, stock availability, storage space and labor allow it. A pre-peak fill of the wrong assortment leaves urgent replenishment competing with picking anyway.
Specify receiving checks, decanting, identification and inventory release separately. The 24-second assumption covers only the defined station transaction, not the whole inbound process. If a shared station needs cleaning, container changes or software mode switching, include those transitions. Keep a named reserve for urgent replenishment instead of assuming all inbound work will politely wait.
Count Complete Orders and Make Room for Exceptions
A shortage can occupy more than checking time. It can hold an order container in a position that would otherwise accept the next order, reducing batching opportunities and increasing repeat donor visits. Decide when the container remains at the station, when it moves to a tracked exception location, and how it returns without duplicating completed picks.
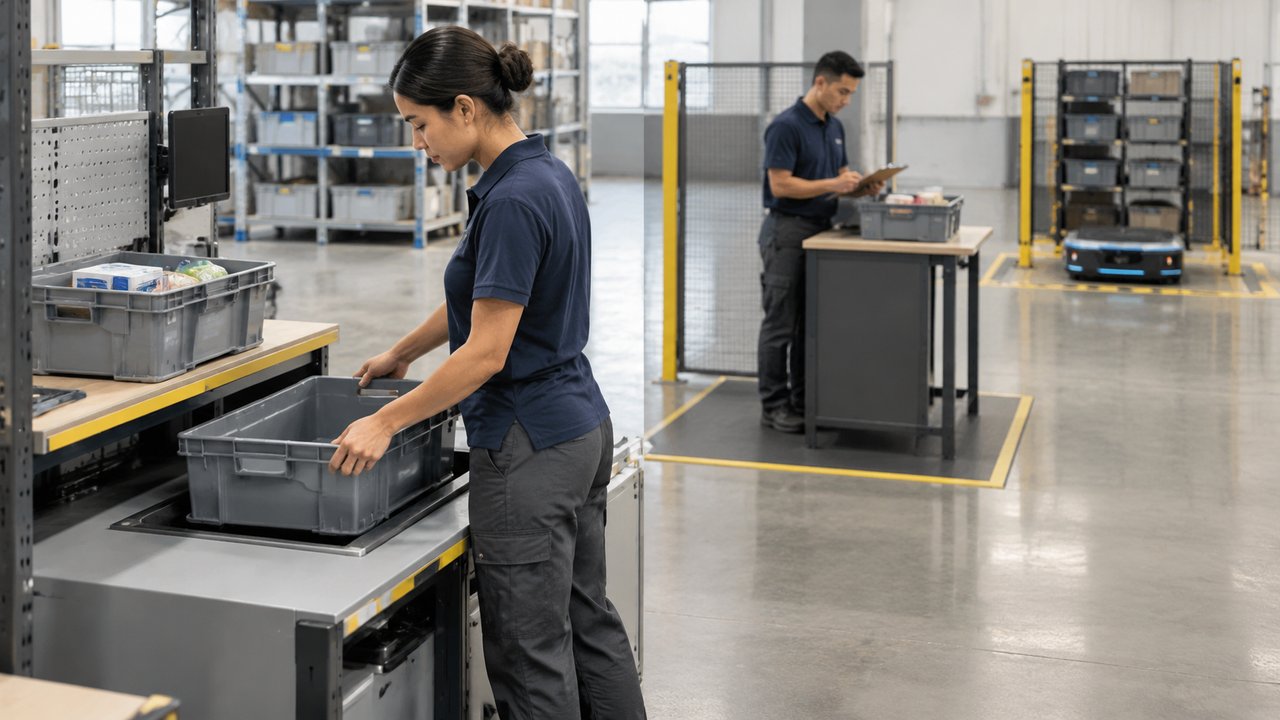
Distinguish a source-bin shortage from a product-identification failure, damaged item or missing order container. These events need different owners and recovery actions. Define whether another donor can satisfy the line, whether inventory is quarantined, and who authorizes a substitution or customer-facing change. The station must retain the correct quantities and order identity through each move.
Record the time from first picked line to complete-order release, alongside completed lines per hour. A design can produce many lines while leaving the oldest orders unfinished. For multi-zone orders, include the final matching and consolidation step. Partial containers should consume visible buffer capacity rather than disappear from the performance report.
Also distinguish available order positions from installed positions. A slot reserved for an oversized carton, a held order or a quality check is unavailable to ordinary batching during that occupation. Track how long each state persists. This connects the physical station layout to the presentation ratio instead of treating the ratio as a permanent software benefit.
Test with a deliberately constrained order-position count and a realistic mix of container sizes. Observe whether workers create unofficial overflow locations or repeatedly interrupt picking to clear completed totes. Those observations can justify a container takeaway or exception-area improvement before another full picking station is purchased.
Check Packing Before Adding Another Workstation
The hypothetical 1,500 lines represent 500 orders per hour only because the model assumes three lines per order. If every order uses one shipping package and packing can release 420 packages per hour, an 80-order backlog develops each hour while those conditions continue. A finite buffer postpones the blockage; it cannot permanently absorb the difference.
Verify packaging demand using the actual orders, not just the average lines-per-order ratio. Oversized products, multiple parcels, documents, gift preparation and label exceptions can change packing work independently of picking. The number of cartons available beside a station also affects order-container exchange time.
For acceptance, run the agreed peak profile through picking and the downstream release point. Start from declared inventory and work-in-progress conditions, and finish with reconciled remaining orders. Report completed orders, late orders, leftover containers and exception workload alongside station utilization. This ties warehouse throughput to service delivered.
Compare at least two relevant mixes: one with repeated popular SKUs and another with less overlap between orders. Keep deadlines, identification requirements and error definitions unchanged. Include a planned container exchange and urgent replenishment during the test. The question is whether the purchased station group completes the required work when batching is less favorable, not whether it can repeatedly demonstrate its easiest hour.
The purchase proposal should state installed stations, simultaneously staffed picking stations, replenishment allocations, donor-delivery assumptions and packing capacity. Price the alternatives that remove the demonstrated constraint: another station, additional labor, more order positions, better container takeaway or changed batching. Goods to person automation is useful when those elements support one coherent operating plan.
Use the AMR and AGV acceptance-testing guide to connect the station trial with the wider deployment acceptance plan.
Focused FAQ
What is goods-to-person picking?
It is an order-fulfillment method that brings inventory to a picking position. A person may still scan, select and place the individual items. The inventory-delivery robot and any item-picking robot perform different jobs and need separate capacity assumptions.
How do you calculate the number of picking workstations?
Add the peak-window time required for line handling, donor presentation work, order-container exchanges and exceptions. Divide by usable staffed time per station, then test delivery gaps, shared replenishment, batching limits and downstream flow. Round up only after confirming those assumptions.
Are bin presentations per hour the same as picks per hour?
No. One donor presentation may support several order lines, one line or none. Define whether a quoted pick means a unit, a line or a container movement. Use the proposed order mix to connect presentation demand with successful line completion.
Does adding more order positions always improve productivity?
No. More positions can allow additional orders to share donor visits, but may increase reach distances, searching and container management. Orders must also be compatible and available together. Test the complete station layout and software batching rules.
Can picking and replenishment share a workstation?
They can where the equipment and workflow support both. Reserve time and labor for each activity, including changeovers. A station processing replenishment cannot simultaneously contribute its full assumed picking capacity; separate receiving preparation may still be necessary.
What evidence should a supplier provide before the station count is approved?
Request event-level timing, a representative order replay, explicit batch and container limits, and a joint picking-and-replenishment schedule. Results should show complete orders reaching the agreed downstream point, with shortages, delays and remaining work visible. Separate simulation predictions from measured performance.
Evidence note: sources checked October 28, 2026. The Kardex announcement provides current project context; the other linked supplier materials provide technical background. The workload calculations are original hypothetical examples, not measured customer results or supplier performance specifications.


